Project Overview
The Sales Analytics Dashboard is a comprehensive web application designed to help businesses track, manage, and visualize their sales data in real-time. It provides an intuitive interface for monitoring key performance indicators (KPIs), managing sales transactions, and generating detailed performance reports. The application bridges the gap between raw data and actionable insights, enabling data-driven decision-making.
Screenshots
Key Features
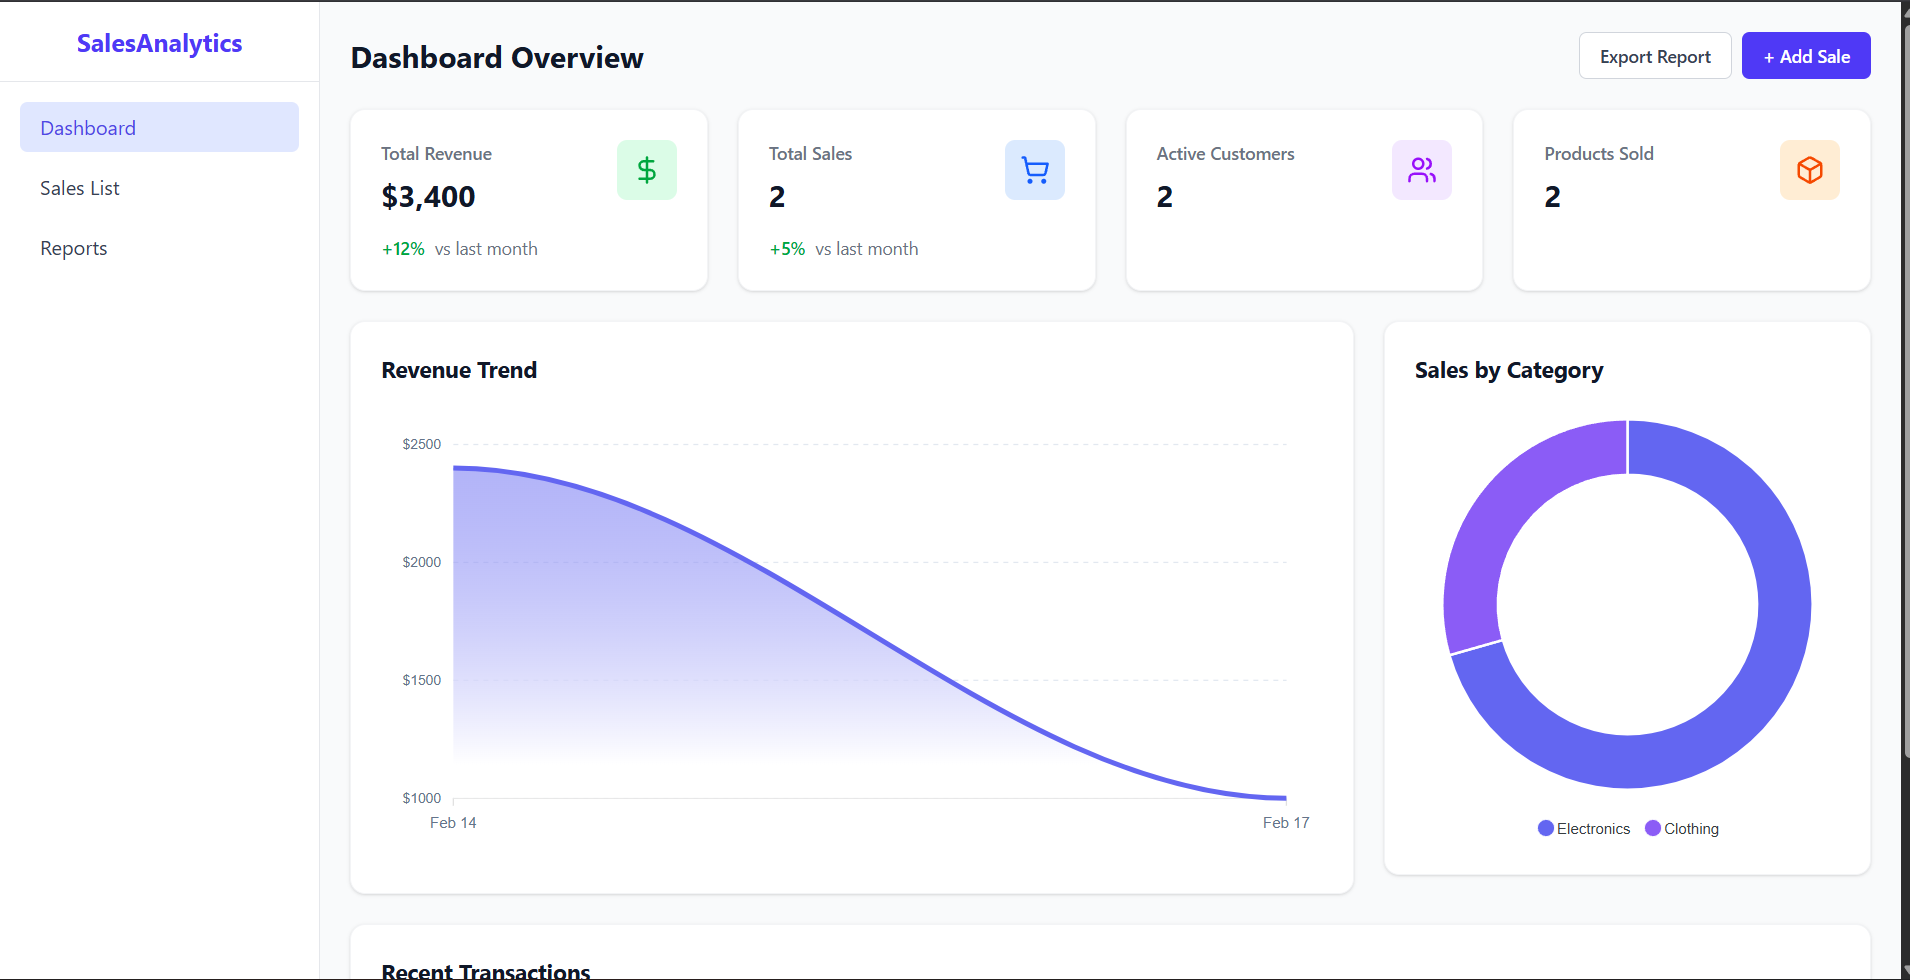
- Interactive Dashboard
- Real-time Overview : Instantly view total revenue, total sales count, active customers, and products sold.
- Data Visualization :
- Revenue Trend Char : An area chart showing sales performance over time.
- Category Distribution : A donut chart visualizing sales distribution across product categories.
- Recent Transactionn : A quick-glance table of the latest sales activities.
- Comprehensive Sales Management
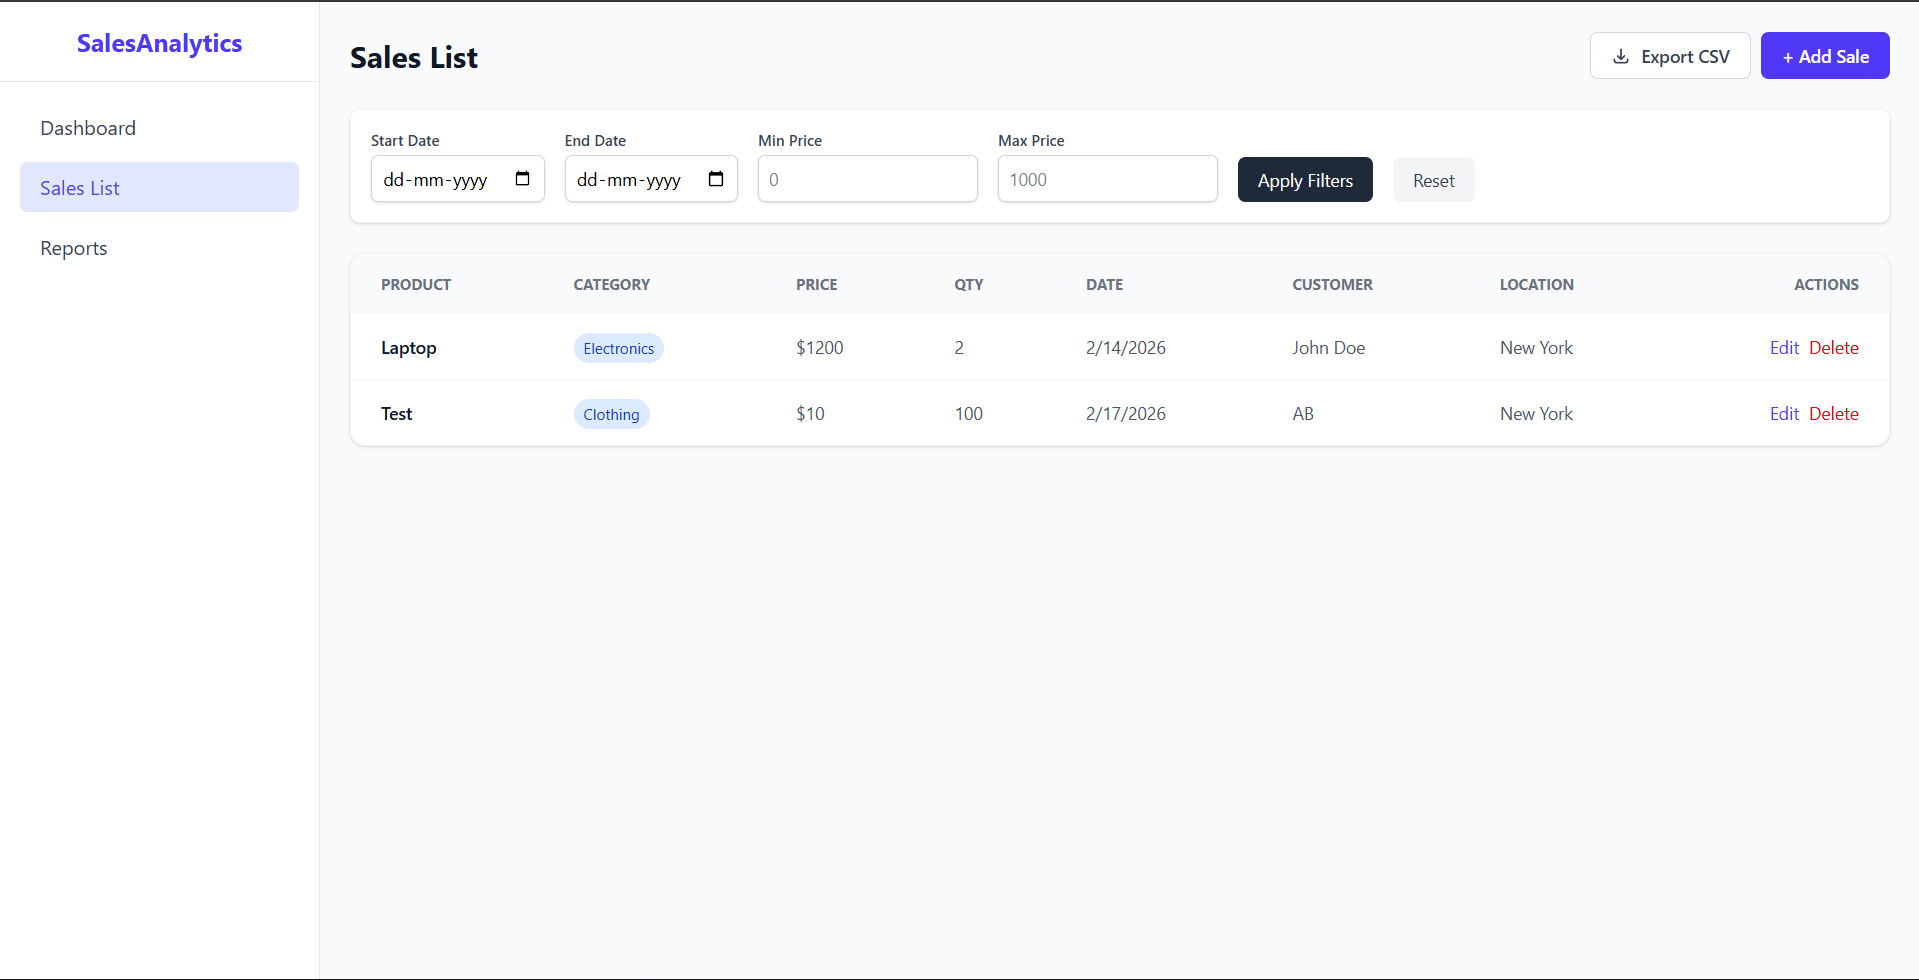
- Sales List : A dedicated page to view all sales records in a detailed table format.
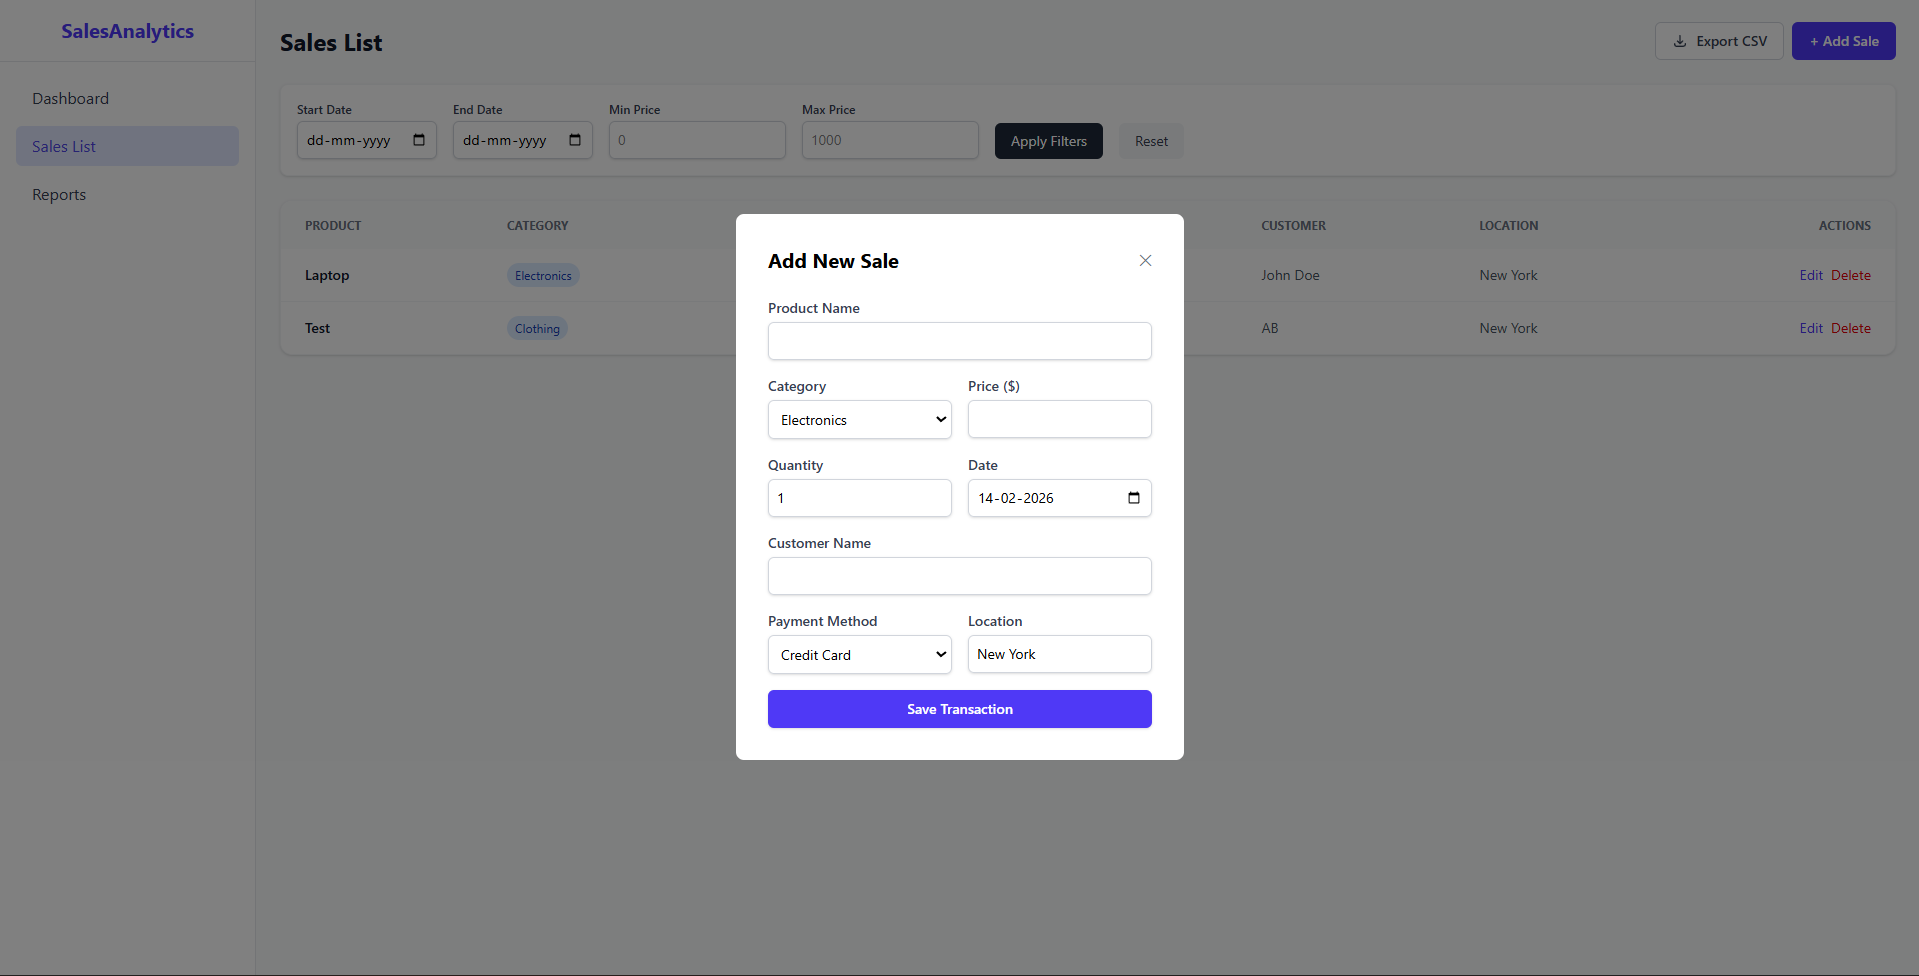
- CRUD Operation :
- Create : Add new sales transactions via a modal form.
- Read : View detailed sales data.
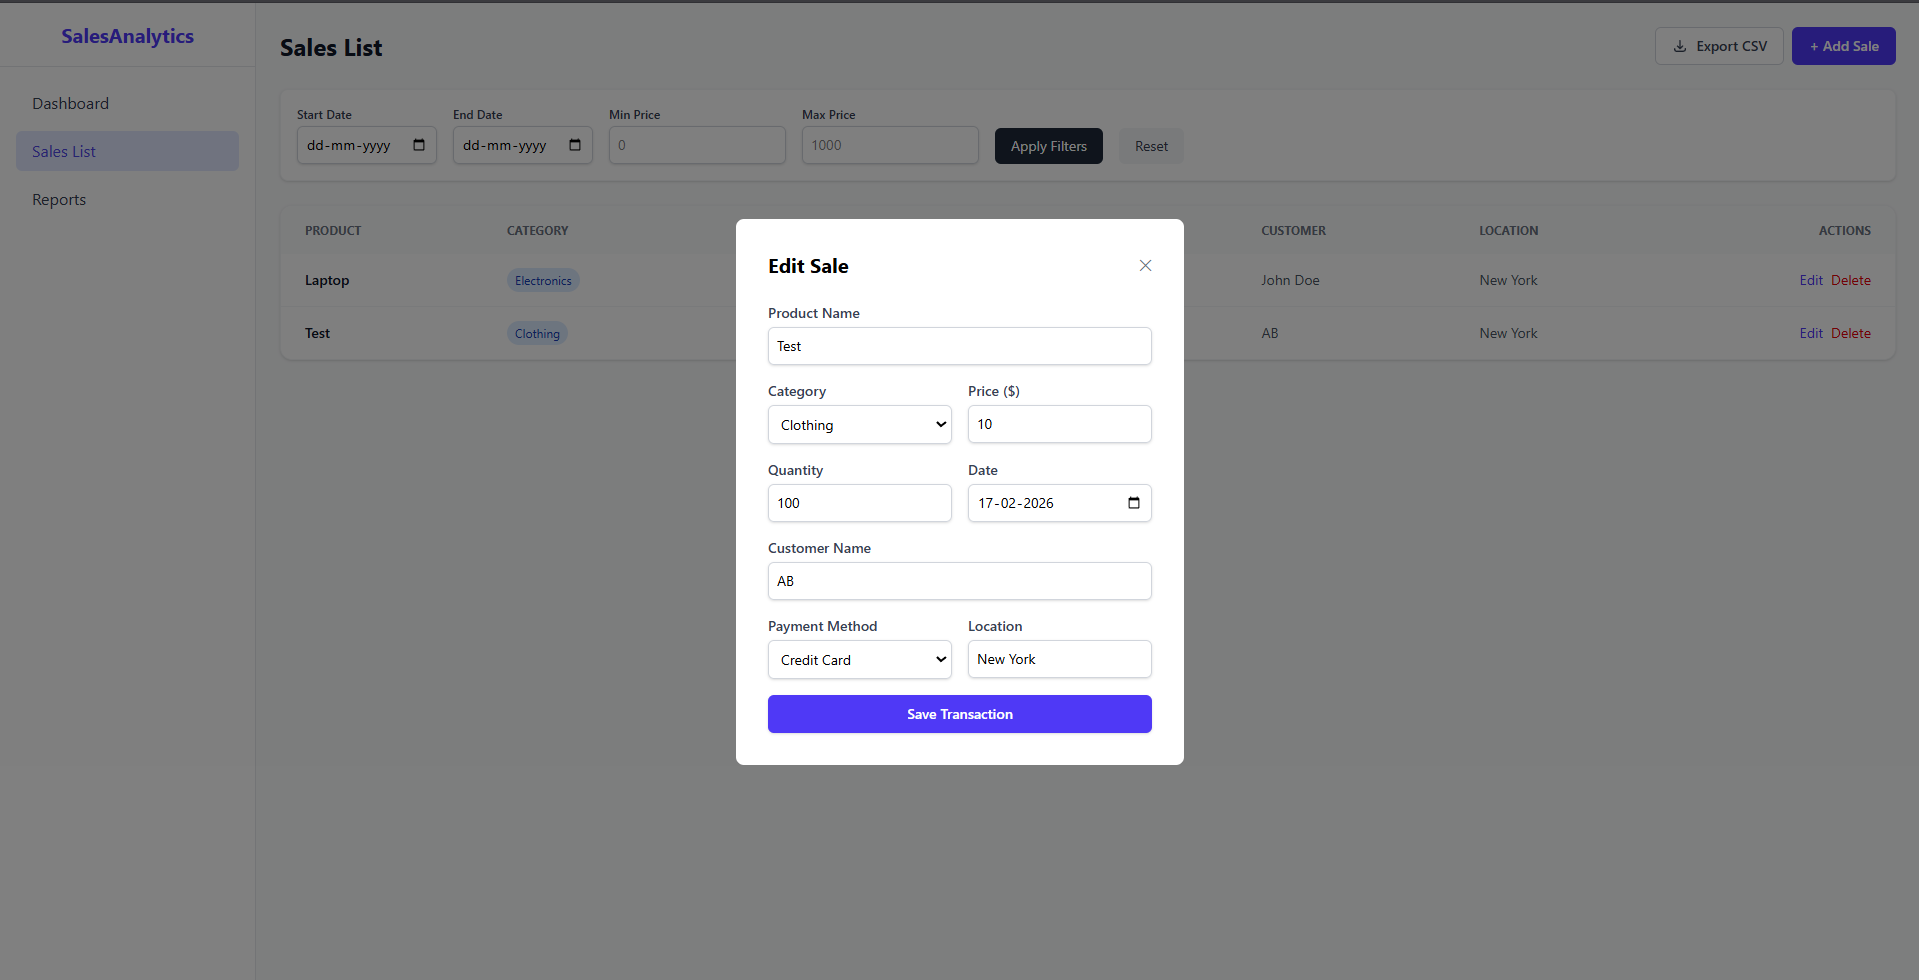
- Update : Edit existing sales records to correct errors.
- Delete : Remove incorrect or cancelled transactions.
- Advanced Filteringhttps://finalyearprojectshub.com/wp-content/uploads/2026/02/Sales-Analytics.zip : Filter sales data by date range and price range to find specific records.
- CSV Export : Download sales data to CSV for external analysis.
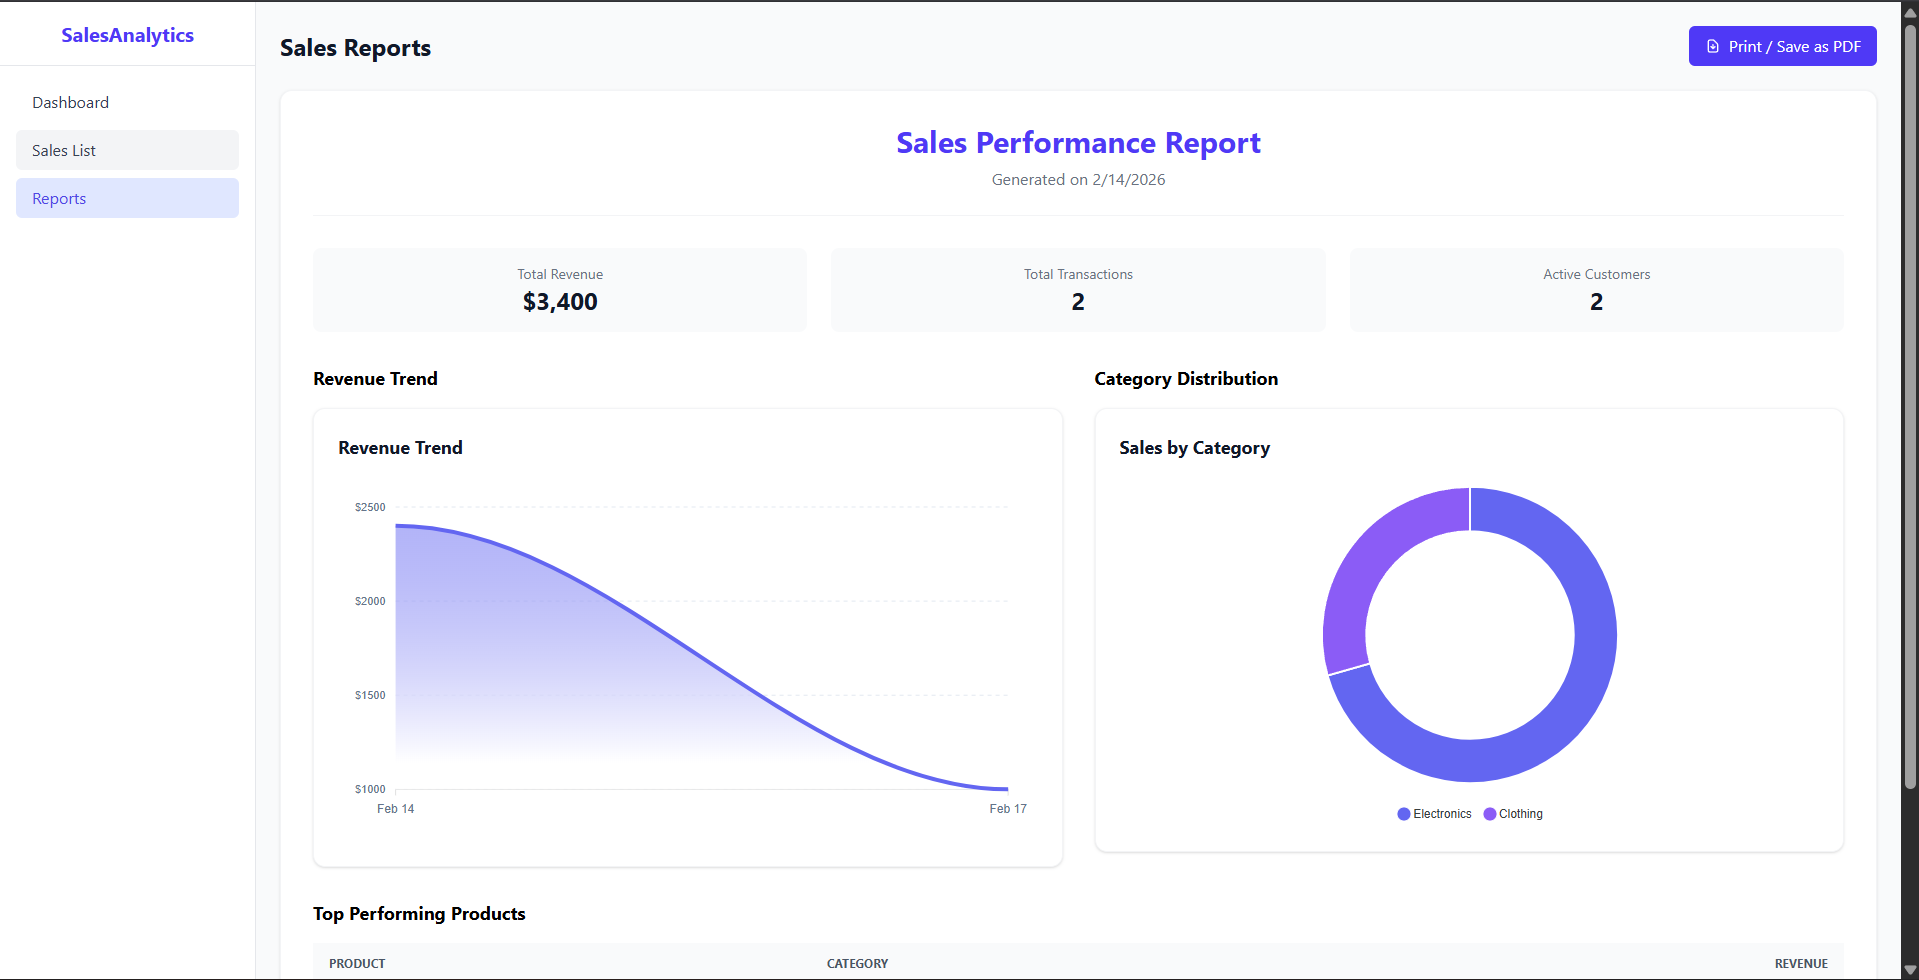
- Reporting System
- Visual Report : A printable report view summarizing financial performance.
- PDF Export : Built-in functionality to print or save the report as a professional PDF document using native browser capabilities.
Functionality
- Data Fetching : Efficiently retrieves sales data from a MongoDB database via a RESTful API.
- State Management : Uses React hooks (`useState`, `useEffect`) to manage application state and data flow.
- Responsive Design : Fully responsive layout that adapts to desktops, tablets, and mobile devices.
- Navigation : Seamless client-side routing using `react-router-dom`.
Technology Used
- Frontend:
- React.js : A JavaScript library for building user interfaces.
- Vite : Next Generation Frontend Tooling for fast development.
- Tailwind CSS v4 : A utility-first CSS framework for rapid UI development.
- ApexCharts : Interactive and modern charting library.
- Axios : Promise-based HTTP client for the browser.
- React Router DOM : Declarative routing for React applications.
- Lucide React : Beautiful and consistent icon library.
- Backend:
- Node.js : JavaScript runtime environment.
- Express.js : Fast, unopinionated web framework for Node.js.
- MongoDB : NoSQL database for flexible data storage.
- Mongoose : Elegant MongoDB object modeling for Node.js.
- Cors : Middleware to enable Cross-Origin Resource Sharing.
- Dotenv : Module to load environment variables.
Why This Project Is Useful
- Centralized Data : Consolidates all sales information into a single, accessible platform, eliminating the need for scattered spreadsheets.
- Instant Insights : Visual charts and KPIs allow business owners to understand their performance at a glance, identifying trends and anomalies instantly.
- Efficiency : Streamlines the process of recording and managing sales, saving time and reducing manual errors.
- Accessibility : Being a web-based application, it can be accessed from any device with a browser, allowing for remote management.
- Scalability : Built with the MERN stack, the application is scalable and can handle growing datasets and feature expansions.
Deployment and Environment Setup
- Environment Variables Setup:
- backend/.env
- PORT: 5000
- MONGO_URI: mongodb_url_string
- JWT_SECRET: your_jwt_secret_key_here (if needed)
- frontend/.env
- VITE_API_URL: backend_url
- backend/.env
- Deployment Overview:
- Render or Railway for backend hosting
- Vercel or Netlify for frontend hosting
- MongoDB Atlas for the database
- Backend Deployment:
- Push your code to GitHub.
- Go to Render.com or Railway.app.
- Create a new Web Service and connect your GitHub repository.
- Choose “backend/” as the root directory.
- Add the following environment variables on Render:
- PORT=10000
- MONGO_URI=your MongoDB Atlas URI
- JWT_SECRET=your JWT secret
- Start command: npm start (Ensure your backend/package.json includes “start”: “node server.js”)
- After deployment, note your backend URL, e.g. https://your-backend-name.onrender.com
- Frontend Deployment:
- Go to Vercel.com or Netlify.com.
- Create a new project and connect the GitHub repo.
- Select the “frontend/” folder as root.
- In environment variables, set:
- VITE_API_URL=https://your-backend-domain.com/api (or REACT_APP_API_URL if using CRA)
- Deploy.
- MongoDB Atlas Setup:
- Go to https://cloud.mongodb.com
- Create a free cluster.
- Add your current IP address in Network Access.
- Create a database user and password.
- Copy the connection string and replace username, password, and database name in MONGO_URI in backend/.env
Download Source Code
Project Setup Instructions
Note: This project is for educational purposes only. Not for commercial sale.